ARCNL helps redefine how we measure roughness in worldwide Surface-Topography Challenge
In the world of surface topography, the roughness of a surface has long been characterized by a single number. But scientists around the world, including Bart Weber and Cyrian Leriche at ARCNL, challenged this with the most thorough analysis of a surface to date. The results, published in Tribology Letters, show that one number is not enough to describe a surface, and that different measurement techniques reveal features at different scales.
A rough measurement
On a molecular scale, the roughness of a surface affects how it makes contact with other surfaces, and how much friction there is when it slides. In computer chip production, this kind of friction can impact the positioning of layers in the chip with respect to one another. In manufacturing, it then becomes important to be able to assess the quality of various material surfaces. This is the field of surface topography, a kind of topography where instead of mapping out the features and elevation of an area of land, you create such a map of the surface of a material on a microscopic level.
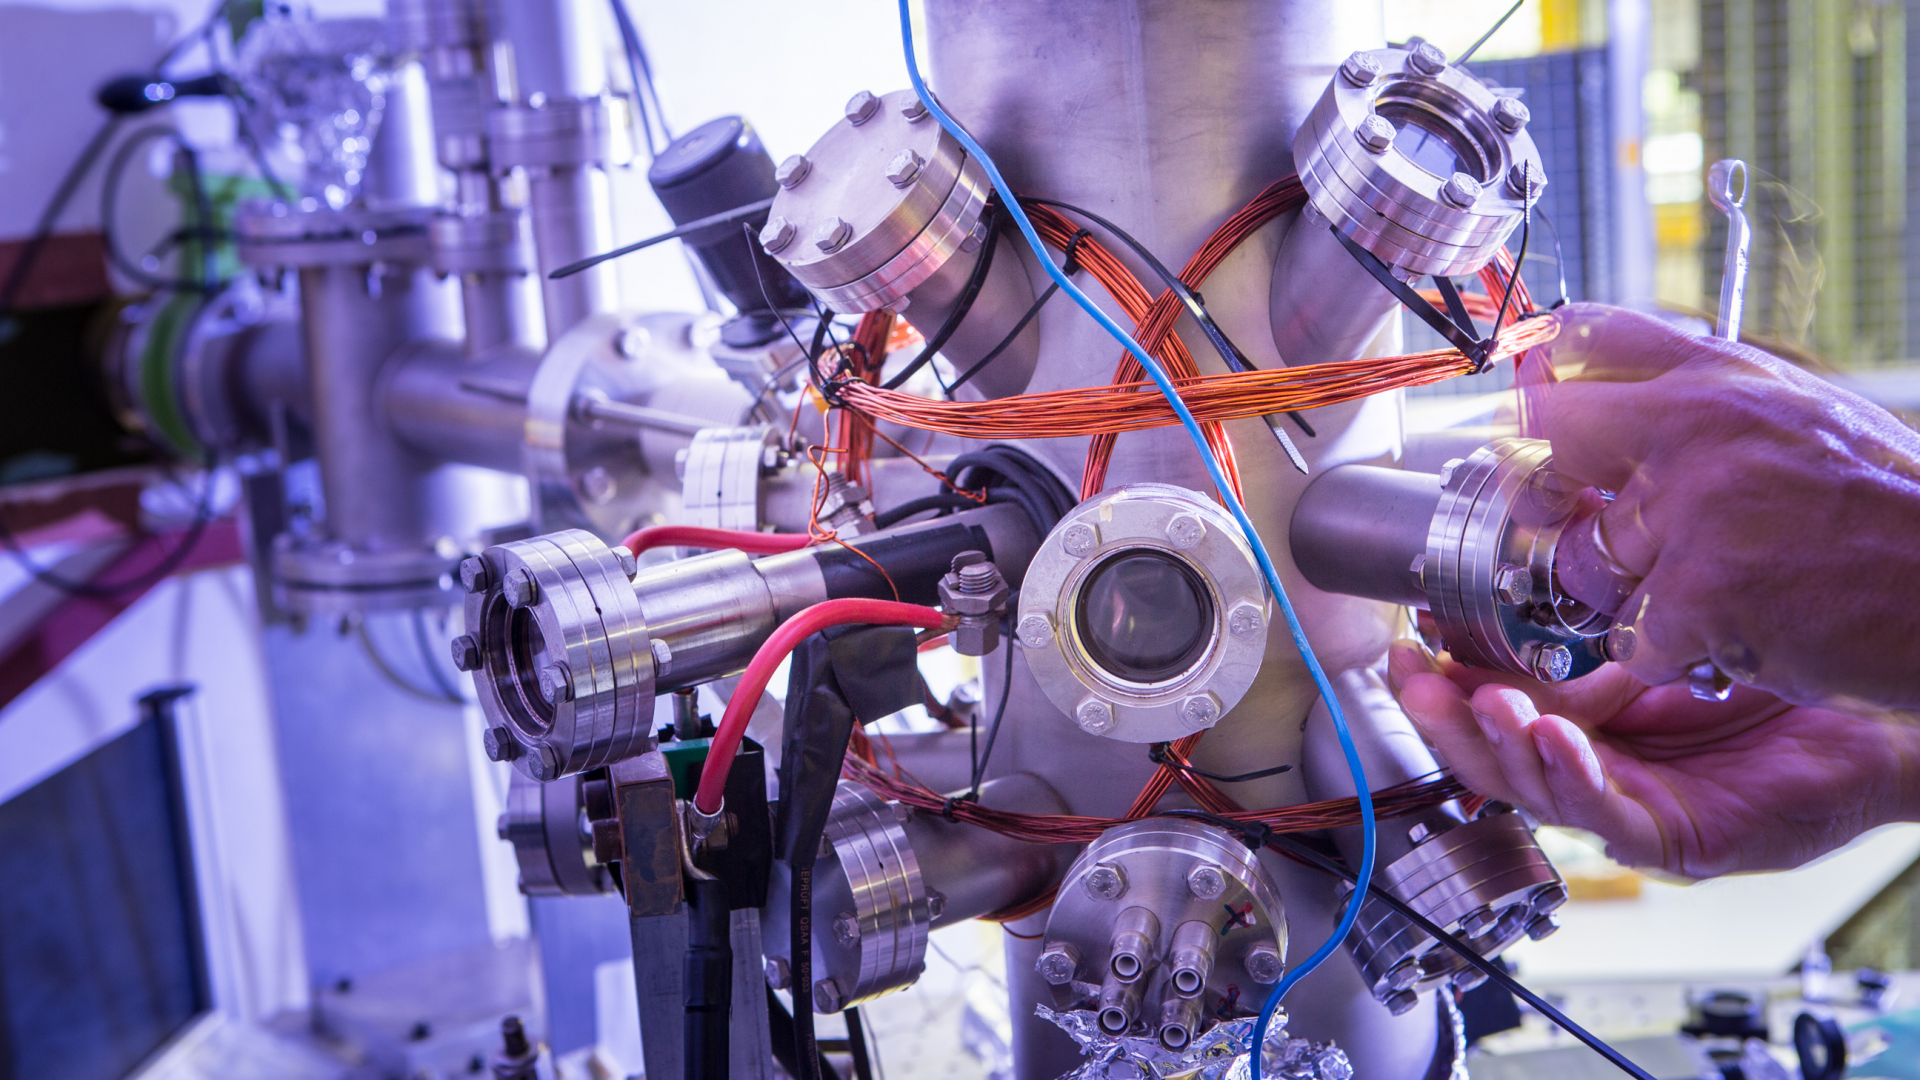
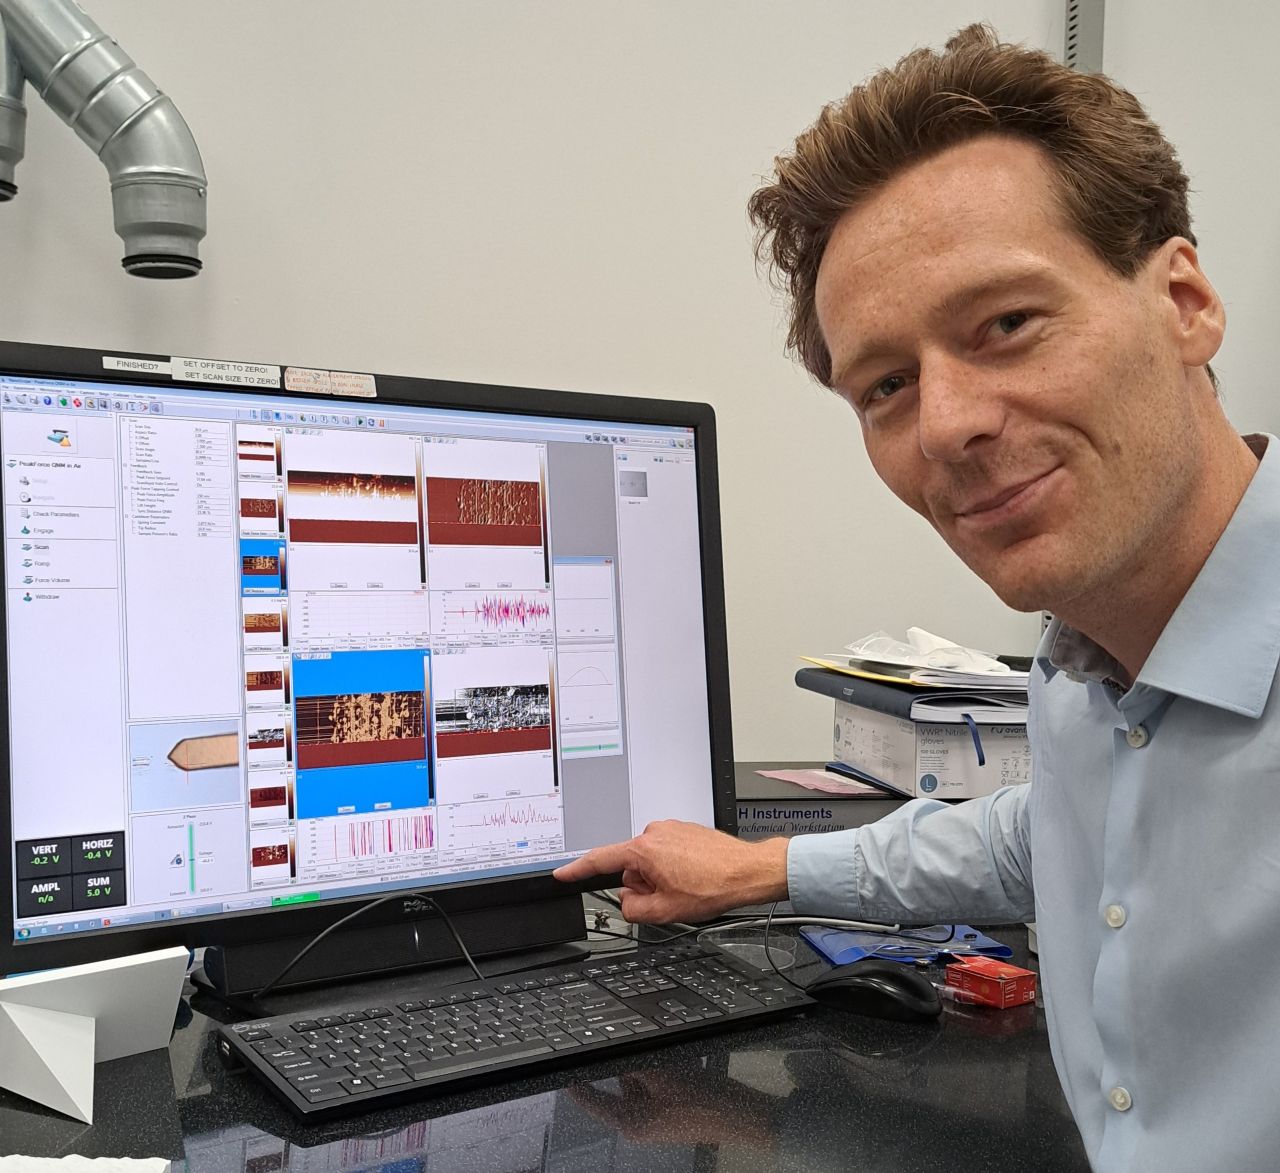
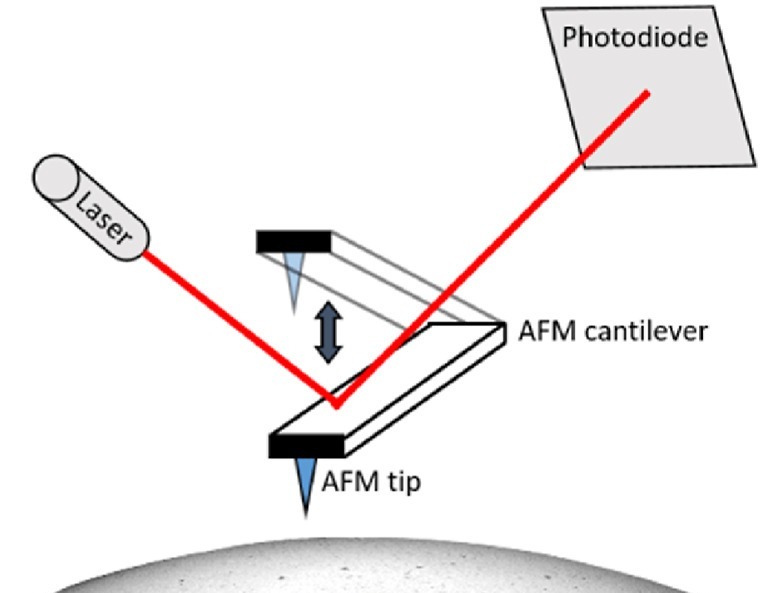
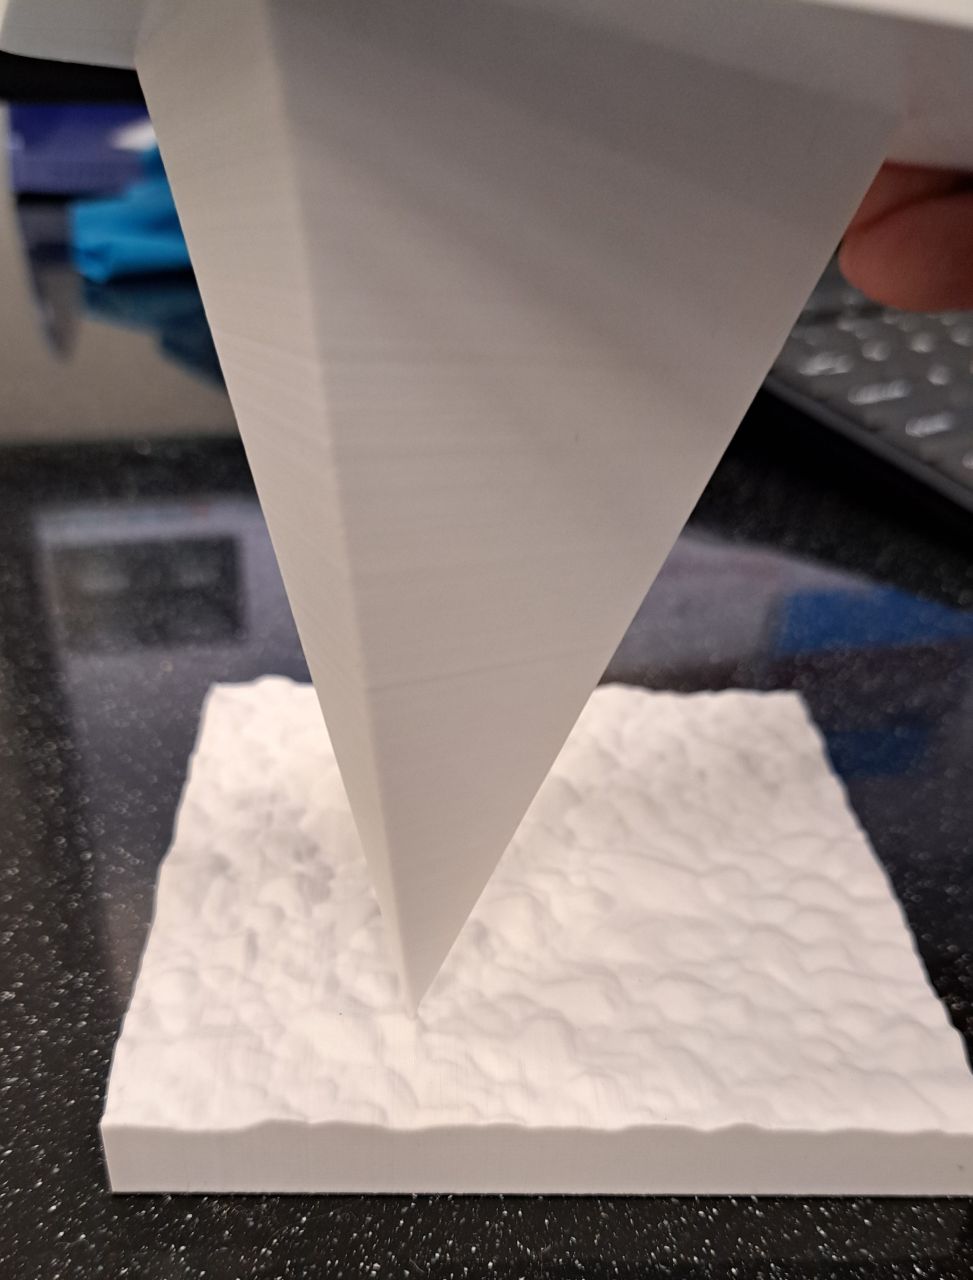
There are many techniques for making surface measurements, using sharp-tipped probes, light, and electrons to scan the surface. In Bart Weber’s lab at ARCNL, he and Cyrian Leriche use atomic force microscopy, also known as scanning probe microscopy. This technique uses an extremely sharp needle-like probe at the end of a long support lever. A laser reflects off the lever, and when the probe moves over features of different heights, the lever moves too, changing the reflection of the laser. The position of the reflected laser is measured, which is so precise that it can measure height changes that are smaller than atoms! And with a tip size of only 10 nanometers, atomic force microscopy can resolve roughness features 10,000 times smaller than a human hair!
A single number barely scratches the surface
Bart and Cyrian used this technique to measure four sample surfaces as part of a collaboration called the Surface-Topography Challenge. The challenge was organized primarily by Arushi Pradhan, Martin Müser, Lars Pastewka and Tevis Jacobs of University of Pittsburgh, Saarland University and University of Freiburg. By collecting and analyzing measurements of the same surfaces from many researchers using different techniques, their challenge resulted in the most comprehensive measurement of a surface ever performed. With this, they’ve challenged the way roughness is measured.
Usually, the roughness of a surface is characterized by one value, labeled Ra, which is the absolute average height deviation from the mean line. This means that you take the average height of the whole surface (the mean line), then look at how far from that height all the peaks and valleys of the surface are (absolute height deviation). The average of this gives a rough indication of how rough the surface is: a higher number means more variation in surface height, meaning a rougher surface.
But roughness is more complex than that, says Bart. “Measuring a small area of a surface gives you a different number than a larger area of the same surface.”
The data collected from 150 challenge participants from around the world confirms this. The organizers’ analysis found that the rougher samples actually looked the same as the smoother ones when zoomed in to small scales, their differences showing only at larger scales. Also, different measurement techniques are better for different scales, making the value of Ra different depending on which technique you measure the surface with.
It’s clear that Ra doesn’t work as a standard descriptor across all surface measurements, because when you calculate it, you lose information, ignoring any features that your specific measuring technique can’t see. This new comprehensive dataset shows the need to instead report roughness descriptors that depend on the scale of the measurement, as well as the need to use multiple measurement techniques to get a stronger description of a surface.
From 61 labs to the real world
Published in Tribology Letters, the findings of the Surface-Topography Challenge may motivate new ways of describing surface topography, by challenging the assumptions made when calculating values like Ra. With 2085 measurements from 61 labs around the world, this challenge produced the most comprehensive description of a surface to date.
Having such a thorough measurement of one surface will serve as useful data to use as input for theoretical models. This way, researchers can get a better understanding of how different manufacturing processes produce different roughness properties, and how roughness measurement techniques may be limited. The dataset also serves as a benchmark to check if an instrument is performing well when measuring roughness. These theoretical and practical uses can support the development of optimal surfaces for, for example, computer chips, making the results of this challenge useful for the semiconductor manufacturing industry in making smaller chips more efficient.
Want to read more about the Surface-Topography Challenge, the different measurement techniques, and results? Access the paper here:
https://doi.org/10.1007/s11249-025-02014-y
Reference
Pradhan, A., Müser, M. H., Miller, N., Abdelnabe, J. P., Afferrante, L., Albertini, D., Aldave, D. A., Algieri, L., Ali, N., Almqvist, A., Amann, T., Ares, P., Balzer, B. N., Baugh, L., Berberich, E. A., Björling, M., Bobji, M. S., Bottiglione, F., … Pastewka, L., & Jacobs, T. D. B. (2025). The surface-topography challenge: A multi-laboratory benchmark study to advance the characterization of topography. Tribology Letters, 73,110. https://doi.org/10.1007/s11249-025-02014-y


